




What is the Risk Assessment Platform?
Your Smart Enterprise-Wide Risk Assessment Solution
Discover the Game-Changing Risk Assessment Platform!
Traditionally, financial crime risk assessments have been conducted using spreadsheets, with GRC platforms serving as a repository of risks and controls - they are simply not designed for a financial crime use case.
Arctic’s multi-award-winning risk assessment platform can digitise spreadsheet-based approaches and automate the inherent risk assessment by ingesting data via APIs or file uploads into customisable risk models, saving considerable time and money, as well as being far more robust, repeatable and reliable. We also white-label our platform for risk consultants.
Compliance. The smart way.
In a constantly changing regulatory environment where the consequences for non-compliance can be catastrophic, why rely on spreadsheets or GRC solutions not built to conduct financial crime risk assessments when you can experience the power of the Risk Assessment Platform?
How mature is your approach to risk assessments?
Enterprise-wide risk assessments (EWRA) have traditionally been performed using spreadsheets, but these are no longer fit for purpose and now there is a much better way to digitise and automate this process regardless of where you are on the maturity curve.
We’ve helped hundreds of companies move away from spreadsheets by deconstructing excel-based financial crime risk assessment models and importing them into our platforms, instantly digitising the process.
And for organisations that have already digitised their approach, we’ve gone one step further and built a data-driven risk assessment feature so you can ingest data directly from your systems directly into our Risk Assessment Platform, either through API data feeds or file uploads, driving huge efficiency gains.
So, where are you on the financial crime risk assessment maturity curve? Why not take our survey below and find out?
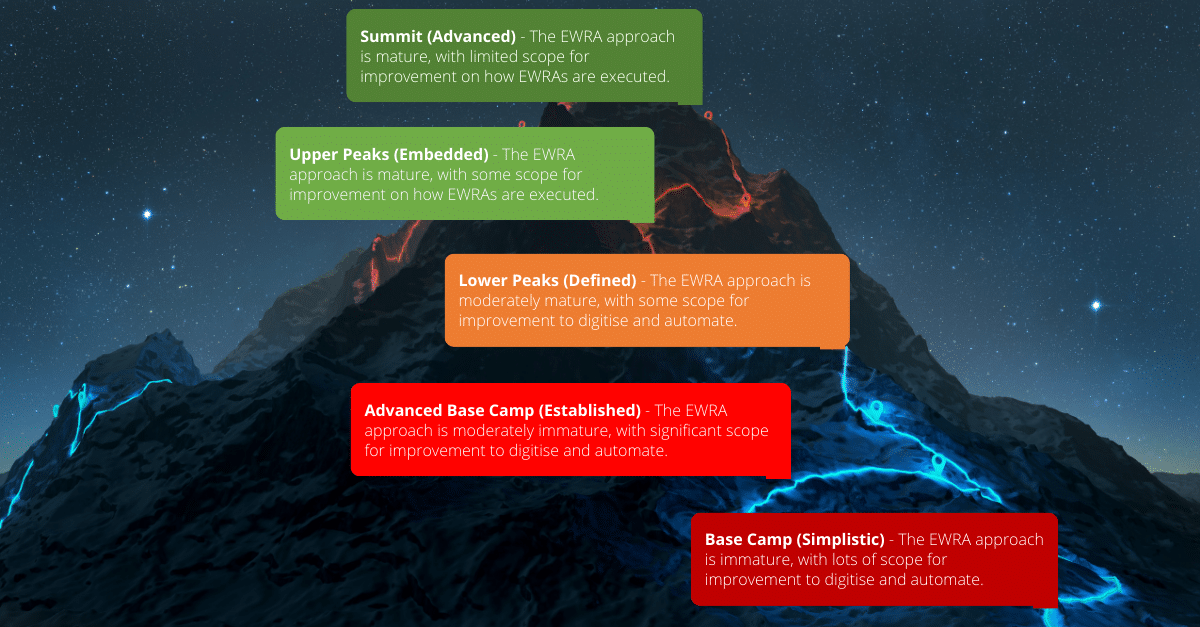
Take the EWRA Maturity Assessment Survey Today
It takes less than 3 minutes.
Digitise and automate your enterprise-wide risk assessment in 6 easy steps
Digitise
For organisations looking to move away from spreadsheet-based approaches and digitise the entire enterprise-wide risk assessment process.
Step 1
Configure the risk methodology
Step 2
Import your risk model content or use ours, apply weightings and answer set thresholds and import the control library
Step 3
Align risk assessments to your organisational structure
Step 4
Assess inherent risks and control effectiveness and automatically calculate the residual risk rating
Step 5
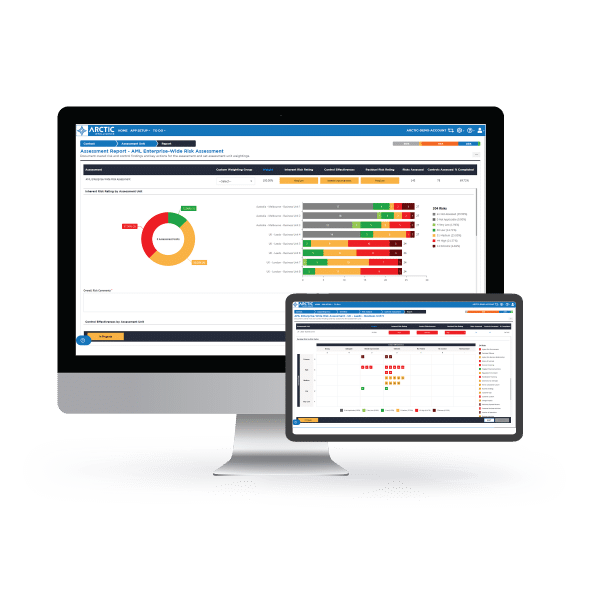
Generate real-time dashboards and reports
Step 6
Document gaps and action plans continuously strengthening your financial crime control framework
Automate
For organisations looking to save time by moving towards a data-driven, objective approach by ingesting data into the assessment.
Step 1
Use our expert-built content, or bring your own
Step 2
Automatically create API data sets from risk models
Step 3
Align risk assessments to your organisational structure
Step 4
Ingest data via API data feeds or file uploads
Step 5
Assess the design and effectiveness of controls
Step 6
Generate real-time dashboards and reports
How the Risk Assessment Platform helps with financial crime and non-financial crime risk management
Customise risk assessments with an adaptable platform
The Risk Assessment Platform is a highly-configurable platform that can be tailored to your organisation’s risk assessment methodology, risk and control libraries relevant to your business and execute these across multiple countries, operating groups or business units, producing real-time dashboards and reports, aggregated across your enterprise
Leverage expert-built risk and control content modules, bring your own or build a hybrid
We have built a suite of financial crime and non-financial crime risk modules, consisting of hundreds of risk indicators and associated controls, for a range of topics including; money laundering and terrorism financing; sanctions; bribery and corruption; fraud; modern slavery; human trafficking, correspondent banking and enterprise-risk management. You can either use these, import your own risk and control libraries or build a hybrid.
Digitise and automate your financial crime risk assessments
Gone are the days when enterprise-risk assessments could only be conducted every 1 to 2 years, primarily because excel-based approaches are fundamentally flawed. Now you can digitise your excel-based financial crime risk model and also automate the ingestion of data directly from your systems directly into our Risk Assessment Platform, either through API data feeds or file uploads, driving huge efficiency gains.
Experience the power of the Risk Assessment Platform Today!
Simplify your approach to financial crime risk management through digitisation and automation and spend more time managing risks, strengthen your defences and protect your business against financial crime.
Industries we support
The Risk Assessment Platform has been tailored to address ML/TF risks across multiple sectors, including financial services, gaming and wagering, gatekeeper professions, high-value goods dealers, professional services and many other industries.
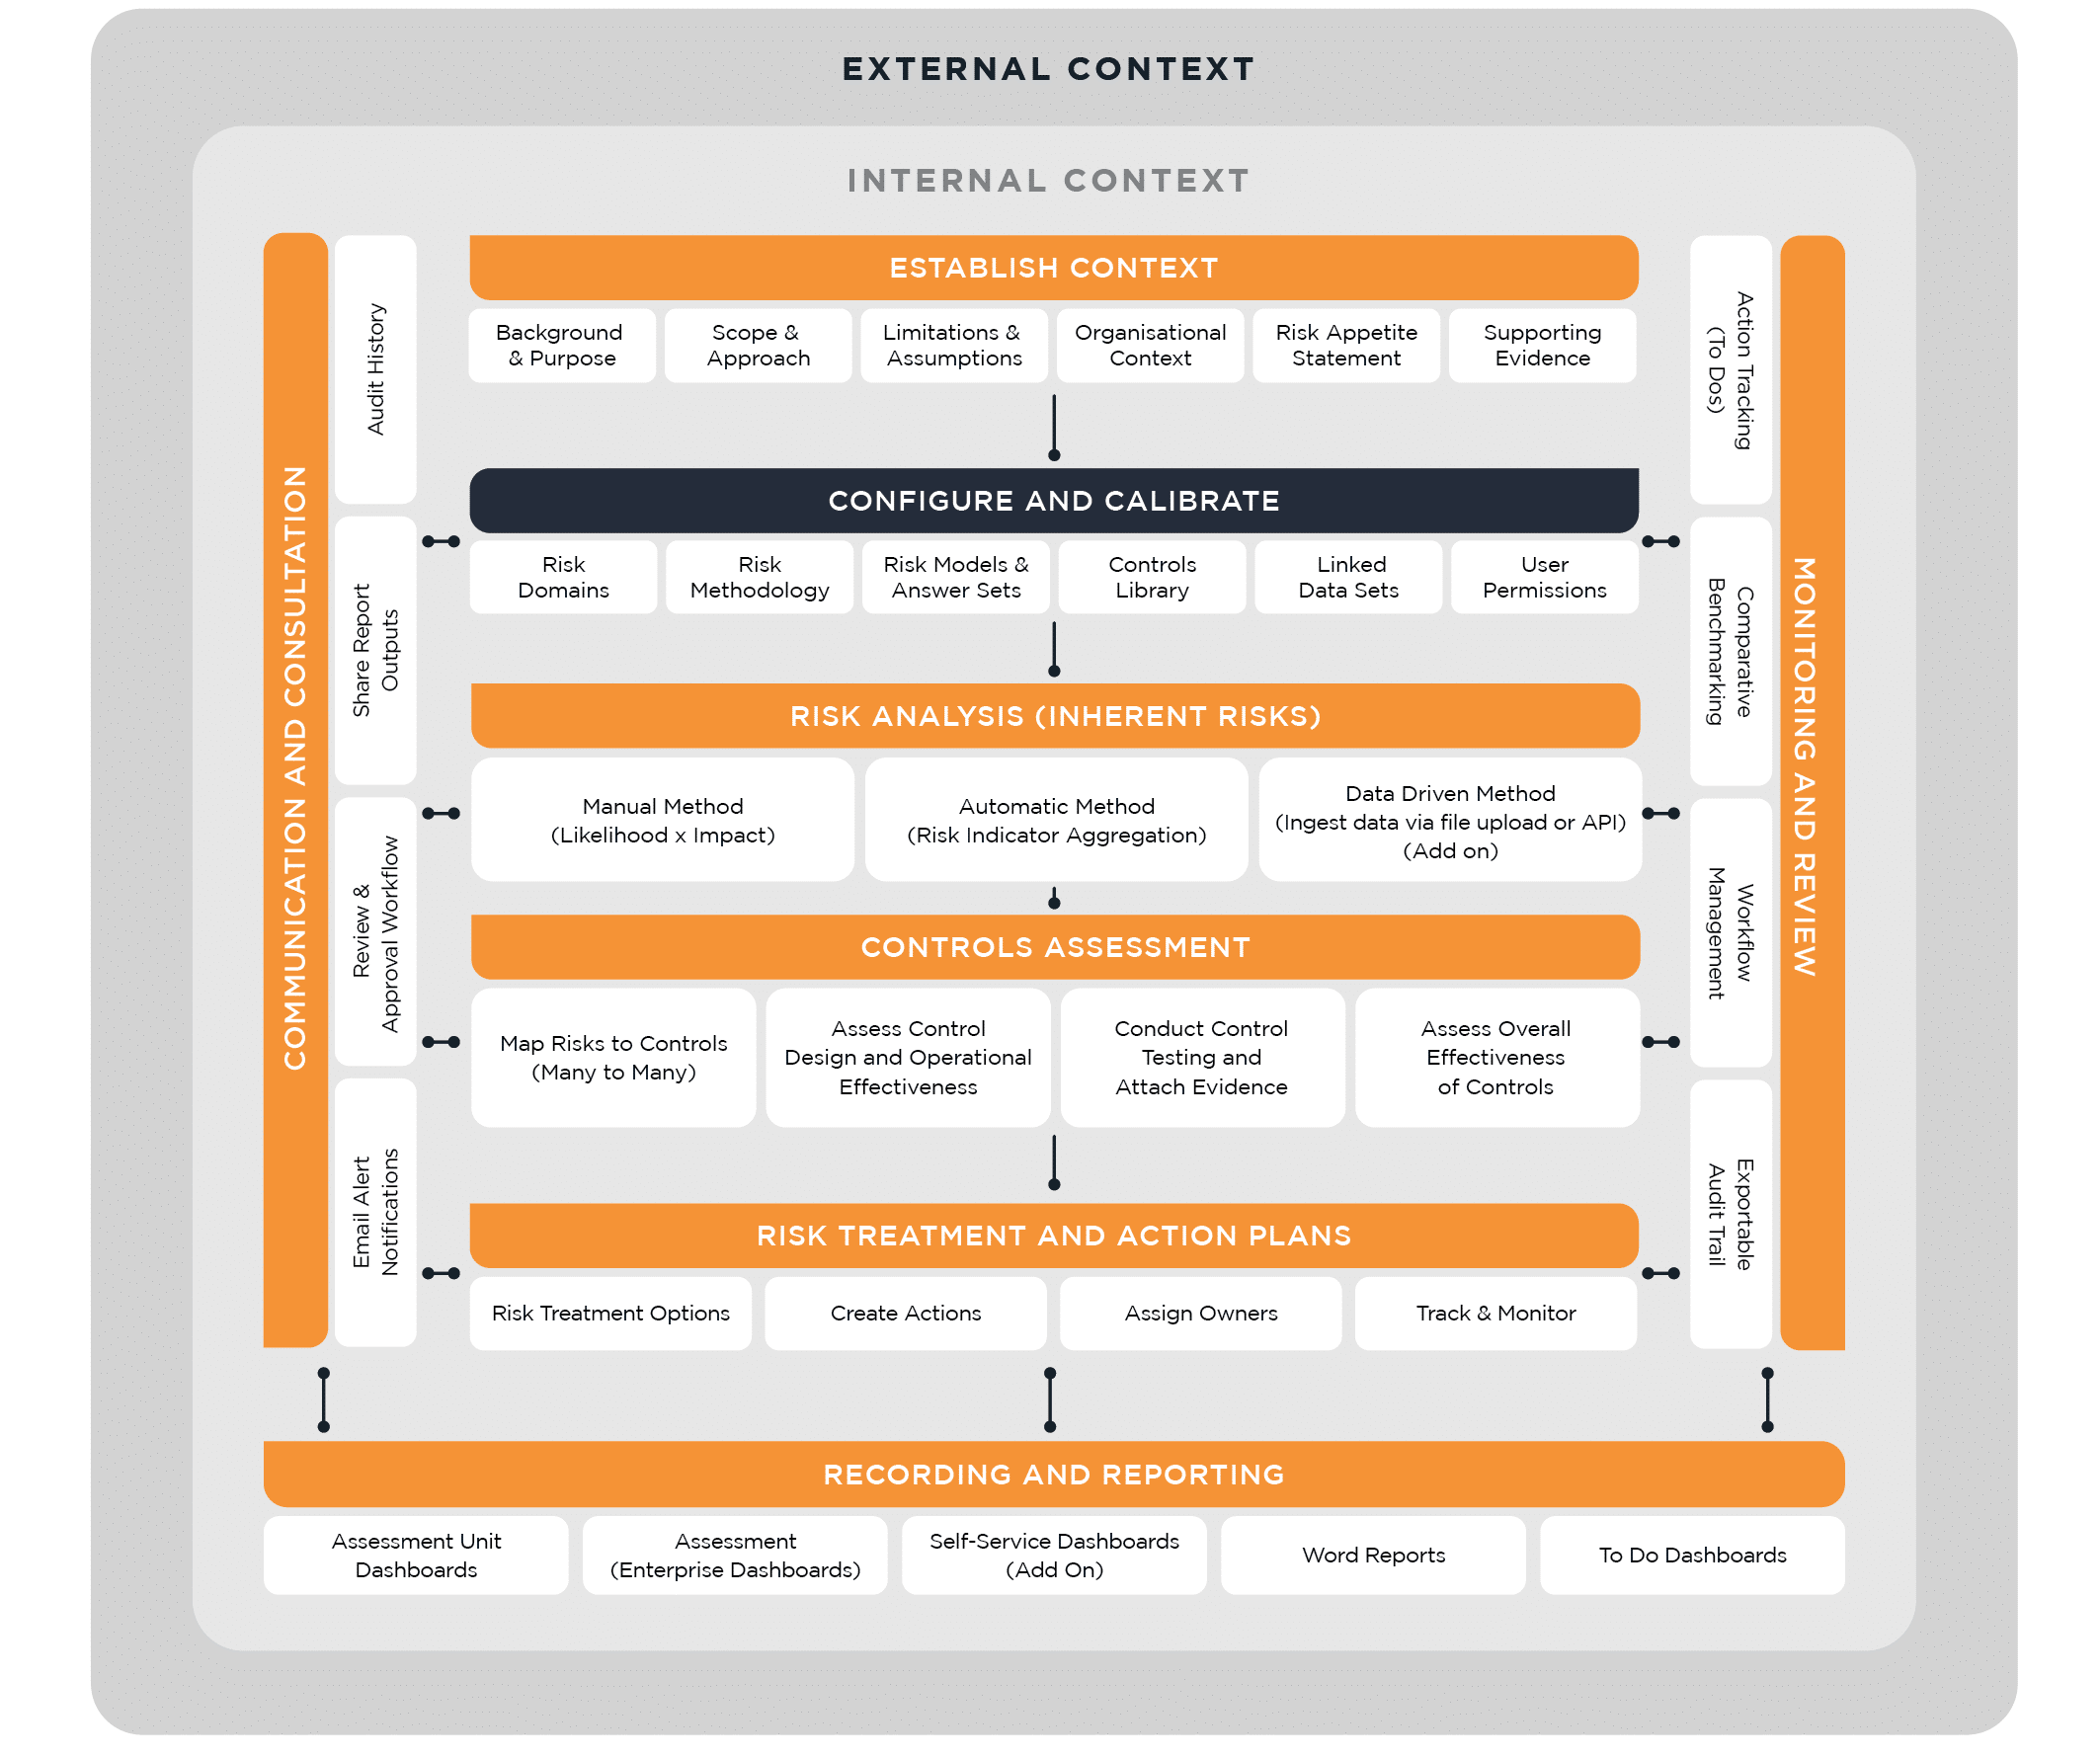
How does it work?
The diagram below visualises recognised industry best risk assessment practices overlaid against the features within the Risk Assessment Platform that supports these processes.
Why choose the
Risk Assessment Platform?
Book your free Discovery Workshop today!
Unlock the future of efficiency with our exclusive, no-cost Discovery Workshop. This personalised consultation is designed to help us understand your current approach to financial crime risk assessments, so that we can recommend how we can help you to digitise, automate and generally improve your risk assessment processes through Arctic Intelligence’s multi-award-winning risk assessment platforms.


